Frequently Asked Questions
Last update : October 7th 2023
LesvePhotometry
Direct links to topics
Pixels in the annulus and spurious stars
How LesvePhotometry is performing Ensemble photometry?
How to cope with very faint Variable stars
How the signal to noise ratio is calculated?
Reporting Fainter Than value
Which data are considered as valid?
How the limiting magnitude is calculated?
Sky brightness calculations
How Instrumental values are calculated in the AAVSO report?
Why to use Instrumental values in the AAVSO report?
"First and Second extinction coefficients"
How the Barycentric Julian Date Terrestrial Time (BJD_TT) is calculated?
My images are clear/unfiltered.
In database, if I make the V (and other filters) magnitude zero....will LesvePhotometry
merely output differential magnitudes? Or will it blow up?
How accurate must the coordinates be?
Which format to use for RA and Dec?
I don't have Excel installed, only OpenOffice spread sheet
Launch LesvePhotometry program from a Command Line
I have more than one Variable in the image field?
Single Filter Transformation
Pixels in the annulus and spurious stars
The background level of the image is derived from the pixels laying in the annulus.
This background level is subtracted from the values of the aperture.
Pixels in the annulus are also used to calculate the Signal to Noise Ratio (SNR).
As it is not always possible to have an annulus free of spurious stars,
the following strategy is applied by LesvePhotometry to cope with the problem:
- Elimination of annulus pixels which are close to a spurious star
(i.e. pixels at a distance less or equal to 1.5 the aperture radius).
This elimination is based on star detection by astrometry routines of PinPoint.
The background calculations will be based on this set of annulus pixels.
Faint spurious stars not detected by PinPoint will not be eliminated by this method.
A special option exists in the "Photometry parameters" tab to allow or
deny elimination of spurious stars in the annulus.
By default the option is set to discard spurious stars.
- The background level is calculated from the median of pixel values contained
in the annulus after elimination of spurious stars.
The median is a way to get a reliable background level despite remaining faint spurious stars in the annulus.
- The standard deviation is also calculated from the same set of annulus pixels.
Spurious stars in the annulus would normally increase the standard deviation of the annulus,
but this effect is reduced as the spurious stars are eliminated from the annulus.
How LesvePhotometry is performing Ensemble photometry?
If you use a single comparison star the target star magnitude (for V band) is provided by the equation
V = (v - r) + R where v and r are the exo-instrumental magnitudes of the target star and of the reference star.
R is the catalog magnitude of the reference star,
this equation can be also rewritten as
V = v + Z where Z is the ZeroPoint of the sky image with Z = R - r.
Ensemble photometric solutions use multiple comparison stars to define the ZeroPoint.
In the "Usage" column of Variable star window,
a R indicates that a star will be used as a Reference star.
For "Ensemble photometry" you select more than one Reference star.
Three methods may be used for Ensemble photomety: "Master star" and "Mean Value" and "Weighted Mean Value" which are described
in a paper written by Tim R. Crawford.
1 - Master star
Untransformed Ensemble
- In the skyimage, the fluxes fi (intensities) of all stars of the Ensemble are summed.
So all the photons of the "Master star" are counted.
vMaster = 2.5 * log10 (Σ fi)
- From the catalog magnitudes, the reference fluxes of all stars in the Ensemble are calculated as
Rflux = 10(-M/2.5) where M is the catalog magnitude.
These reference fluxes are summed to obtain the reference magnitude of the RMaster = -2.5 log10(Σ Rflux).
In this case the ZeroPoint of the sky image Z = RMaster - vMaster
Usual differential photometry (based on the ZeroPoint) is performed for target, references, check and other comparison stars.
Notice that reference stars with a lower brightnesses have lower contributions in the flux of the master star. And the result of "Master star" method is similar to a weighted mean.
Transformed Ensemble
The reference magnitudes of the "Master star" are calculated in each filter bands involved in the Transformation.
The color indexes of the Master star are derived from these calculated reference magnitudes.
With those information, target, references, check and other comparison stars are transformed based on color indexes and
magnitudes of the Master star.
2 - Mean Values and Weighted Mean Values
Untransformed Ensemble
The ZeroPoint (Z) of the sky image is calculated as the Mean or the Weigthed Mean
of (Ri - ri) where Ri are the catalog magnitudes of the Reference stars
and ri are the exo-instrumental magnitudes of the Reference stars.
For the Mean method Z = (Σ(Ri-ri)) / N where N is the number of Reference stars
All the reference stars have the same weight in the ZeroPoint evaluation.
For the Weighted Mean method, the weights are the variance reciprocals (1/σi2) of reference star magnitudes.
σi2 = (1.0857 / SNRi)2.
And ZeroPoint is calculated as Z = (Σ((Ri-ri) * wi)) / Σ(wi) where wi = 1/σi2
Notice that reference stars with bigger variance (a lower SNR) have lower contributions in ZeroPoint evaluation.
For the target, references, check and comparison stars, the untransformed magnitudes V are calculated/reported as V = v + Z where v is the exo-instrumental magnitude of the star.
Transformed Ensemble
For the transformed magnitudes, the transformation process is individually applied on untransformed magnitudes for each reference star and then the mean or the weighted mean value of transformed magnitudes is calculated/reported.
The weights are calculated as explained for Untransformed Ensemble.
How to cope with very faint Variable stars
The first step in the photometry process is to run PinPoint (astrometry engine) on sky image.
PinPoint provides a list of detected stars and LesvePhotometry identifies the variable and
comparison stars in this list.
By default LesvePhotometry puts the photometry aperture on the centroid pixel from astrometry data.
If a star is very faint PinPoint will not be able to detect it. When that occurs, for a Reference star (R)
and for a check star (CK) the program generates an error, skips this image and will continue with the next one.
If the variable star is not detected, in the reports the variable magnitude will
be set to NaN (Not a Number).
But you have an option "If Variable is not detected by PinPoint place Variable aperture at sky coordinates" in the "Photometry parameters" tab to center the Variable aperture on the pixel
corresponding the variable sky coordinates even if the star is not detected.
If you use this option verify carefully the results and the aperture position.
Reporting Fainter Than value
For Cataclysmic Variable stars (CV) in quiescence state and which are not detected visually or by photometry,
it's a good AAVSO practice to report the CV magnitudes as "Fainter than" (e.g. <16.5).
The reported value may be evaluated as the "Limiting Magnitude" which is defined as the magnitude of an object having a SNR=3.
See the section 4 of https://www.aavso.org/ccd-views-315 for reference
and section to know How the limiting magnitude is calculated?
To activate this option, select the check box "Report Fainter than and low SNR" in the "Photometry parameters" tab.
Each observation is subjected to Validity Tests before it is included in AAVSO and CBA reports.
The list of Validity tests is given in section
Which data are considered as valid?,
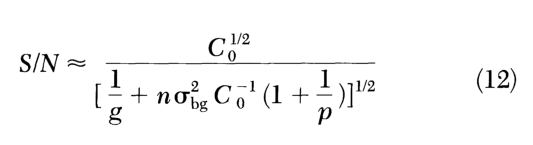
How the signal to noise ratio is calculated?
The signal to noise ratio takes account of the Poisson and background noises and the CCD gain.
The calculation is performed in accordance to the relation (12) of the Newberry's article
Signal-to-Noise consideration for sky-subtracted CCD data
http://adsabs.harvard.edu/abs/1991PASP..103..122N
with
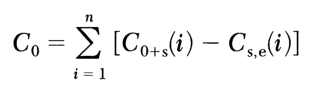
where
- Co+s(i) is ADU of pixel i that is attributable to the object
plus the ADU attributable to the background (sky) and Cse(i) is the estimated ADU in the background of pixel i.
- n is number of pixels in the aperture
- g is the gain factor of the camera given in electron/ADU. This value is given in the image FITS header as EGAIN
- σ is the background standard deviation
- p is the number of pixels in the annulus used to evaluated the background.
Which data are considered as valid?
AAVSO and CBA reports are intended to be published and there contents will be limited to valid data.
But in the Excel and csv reports, all the data points are reported even if they do not seem valid.
The Excel and csv reports contain a column named "ValidData", values are OK or NOK.
A data point is considered as valid (i.e. OK) and will be included in the AAVSO and CBA reports, if all the following conditions are met :
- the variable star, reference stars and check star have been detected and their magnitudes evaluated
- the maximum pixel value in the aperture is lower than the specified Saturation value.
- the star Flatness value is lower than the specified value.
- the SNRs of variable, reference and check stars are greater than the minimum value specified in the "Photometry param"tab
If you have no data in AAVSO or CBA reports, check if your validity constraints are not too strict.
If the "Report Fainter than and low SNR" checkbox is checked and provided the reference and check stars pass the normal tests,
the data will be considered as valid
even if the Variable SNR is lower than the specified value in "Photometry param" tab.
Those data will be included in the reports,
indeed it wouldn't make sense to report "Fainter than" observations and not observations with an SNR above 3.
And if the Variable SNR is lower than 3 or if the Variable magnitude can't be evaluated
- in Excel report the ValidData value will be "< xx.xxx"
where xx.xxx is the Limiting Magnitude
- in AAVSO and CBA reports the Variable star magnitude will be reported as "< xx.xxx" according to
AAVSO specification.
How the Limiting Magnitude is calculated?
In September 2003 AAVSO recommended a method to determine the "Limiting Magnitude". See the section 4 of the following document:
https://www.aavso.org/ccd-views-315
The limiting magnitude for photometry of an image was standardized on the magnitude of an object with a SNR_limiting of 3
From
M2 = M1 - 2.5 log (Flux2 / Flux1)
we get
Mlimiting = Ma + 2.5 * log10 (SNRa / SNRlimiting) (equation 1)
where Ma = Magnitude of star, SNRa is the SNR of this star and SNRlimiting (=3)
The AAVSO recommended to use any FAINT star for Limiting Magnitude evaluation.
Indeed the equation (1) assumes that the ratio (SNRlimiting / SNRa) is linear in respect to fluxes.
This is not the case if the SNR is calculated correctly with the equation (12) of Newberry article
(see above in How the signal to noise ratio is calculated?).
The equation (12) of Newberry is not linear in respect to flux because it takes account of the CCD gain factor (g)
which affects the "Poisson noise" contribution. For weak signals, the background noise has the larger contribution in respect to "Poisson noise".
If the gain factor is not taken into account in the SNR calculatios the ratio of SNR's is linear in respect to fluxes as assumed in above equation (1).
For Limiting Magnitude evaluation, LesvePhotometry calculates the SNR with (1/g = 0).
In this way, the restriction on using faint stars for limiting magnitude may be lifted.
LesvePhotometry uses the first Reference star (R) for the Limiting Magnitude evaluation.
Sky brightness calculations
The sky brightness is calculated as described in
"An Introduction to Astronomical Photometry Using CCDs" by
W. Romnishin (University of Oklahoma)
http://www.physics.csbsju.edu/370/photometry/manuals/OU.edu_CCD_photometry_wrccd06.pdf
Excerpt :
Now, we have a star with a known magnitude and a measured number of counts,
and a sky patch of a known angular area with a measured number of counts but
an unknown magnitude. To calculate the magnitude of the sky patch, we use
the fundamental equation relating magnitude differences to the brightness
ratio of two sources, here the sky patch and star:
mstar - msky = -2.5 log10(Bstar/Bsky)
or
msky = mstar - 2.5 log10 (Bsky / Bstar)
Here the m's are the magnitudes of the star and of the one arcsec square
patch of sky, and the B's are the brightnesses (or fluxes) of the star
and sky patch. For the brightnesses, we simply use the counts.
(The counts are not the true brightnesses, which are given in units of
energy per unit time per unit area, but the counts are related by
a constant multiplicative factor to the brightnesses. The constant
is the same for star and sky, as the sky and star were observed with
the same telescope, detector and exposure time, so it cancels in the brightness ratio.)
V sky brightness observed at Kitt Peak in Arizona is about 21.9 magnitudes per square arcsec.
If the Bsky value is negative, logarithm evaluation will generate an error
and the Sky Brightness will be reported as NaN (Not a Number)
The sky brightness calculations will be wrong if the keyword PEDESTAL of the FITS header
is not evaluated correctly during the Calibration (bias, dark, flat).
This PEDESTAL value can be overridden, the "Photometry parameters" tab has a check-box
"Override PEDESTAL keyword with". If checked, the value entered in the associated textbox
will be added to background level for Sky Brightness evaluation.
The "Limiting Magnitude" (i.e. the magnitude of a star which would have a Signal to Noise SNR = 3)
is not affected by the value of keyword PEDESTAL.
Which format to use for RA and Dec?
Right Ascension has to be entered in hours (sexagesimal or decimal format)
Declination has to be entered in degrees (sexagesimal or decimal format)
Sexagesimal format is very flexible, the ASCOM functions are used for the conversion :
The sexagesimal to real conversion methods such as this one are
flexible enough to convert just about anything that resembles sexagesimal.
Thee way they operate is to first separate the input string into numeric "tokens",
strings consisting only of the numerals 0-9, plus and minus, and period.
All other characters are considered separators. Once the input string is parsed
into tokens they are converted to numeric. If there are more than three numeric tokens,
only the first three are considered, the remainder are ignored. Left to right positionally,
the tokens are assumed to represent units (degrees or hours), minutes, and seconds. If only
two tokens are present, they are assumed to be units and minutes, and if only one token is
present, it is assumed to be units. Any token can have a fractionsl part. Of course it
would not be normal (for example) for both the minutes and seconds parts to have fractional
parts, but it would be legal. So 00:30.5:30 would convert to 1.0 unit.
Note that plain units, for example 23.128734523 are acceptable to the method.
My images are clear/unfiltered.
Q : My images are clear/unfiltered. (FITS header contains the filter information, and filter is named C ).
Do I have to take special actions to properly process/analyze my unfiltered images?
A: No, LesvePhotometry will use the V database magnitudes. In the AAVSO report, the filter field will be CV.
See the aavso-extended-file-format document.
In database, if I make the V (and other filters) magnitude zero....
Q : If I make the V (and other filters) magnitude zero....will LesvePhotometry
merely output differential magnitudes? Or will it blow up?
A : If you enter 0 as a magnitude for a comparison star it will work as
differential magnitude.
But if you enter nothing, the program will complain about lack of
magnitude for the comparison star.
How accurate must the coordinates be?
Q : How accurate must the coordinates be? If I'm off by 0.5 arcsec in
declination...will that cause PinPoint to fail to find/use that comp star?
A : LesvePhotometry puts a limit on distance to accept a star as a
comparison star. This limit is 3 arcsec.
Q : Are the RA/Dec J2000?
A : Yes
I don't have Excel installed, only OpenOffice spread sheet
Disable the Excel report generation in the "General Settings" tab and check the "Csv report" option.
How Instrumental values are calculated in the AAVSO report?
Instrumental magnitude = - 2.5 * Log10(Flux)+ 30
where Flux is calculated as the sum of [ pixel values (ADU) inside the aperture - mean background pixel value]
A value of 30 is choosen as zeropoint to avoid negative instrumental values.
Why to use Instrumental values in the AAVSO report?
Here a copy of the interesting Arne's explanation
QUOTE
Hi Pierre (and Jim),
The AAVSO Extended Format was designed very carefully to contain the maximum amount of
information in the fewest number of bytes. Specifically, both the comparison star magnitude
and the check star magnitude are to be *instrumental* magnitudes. Instrumental magnitude
in this sense is -2.5 log (count_sum) for each star, plus an arbitrary zeropoint. That
zeropoint has to be the same for comparison and check, and if you are taking a time series,
the zeropoint should be the same for all images in the series. However, how the instrumental
magnitude is zeropointed is not important; you are not trying to match the standard system,
but to provide information about the conditions when the observation were made and the quality
of the observation.
The reasoning:
The standard magnitudes for both C and K are already defined, since you provide the VSP chartID
which contains the magnitudes used for the sequence, and the CNAME/KNAME fields identify which
stars of the sequence were used for the estimate. You don't need to repeat that information by
using Cstd in the CMAG field.
(K-C) from the CMAG and KMAG fields gives a reliable error estimate for a time series, whether
or not the software or user provides good uncertainty estimates for the target. The requirement,
however, is that both C and K *have* to be instrumental magnitudes, or (K-C) will be undefined.
C (or K) from a time series, when they are in instrumental magnitude form, tell the researcher
how stable the atmosphere was during the series. If C varies by a few hundredths, then conditions
were stable; if you see big dips in the magnitude of the comparison, then you know that clouds
were around and those target measures may be less reliable. The instrumental magnitude for C or K
will also show you the trend of magnitude vs. airmass so that a researcher may be able to remove
extinction effects.
For ensemble calculations, C and K get more difficult to use in the manner shown above. What
we have come up with is that C remains undefined (though in hindsight, we might have asked for
the instrumental magnitude of some arbitrary star in the field), and K is defined as a separate
star from the target, but measured with the same ensemble. The reasoning here is so that a researcher
can look at the measured K value, compare it with a new calibration of the standard value of K at a later date,
and adjust your observation with an offset to match the latest calibration. This is required since we don't
know what stars went into the ensemble and so cannot adjust the ensemble offset. We lose the uncertainty estimate
given by (K-C), but assume that anyone doing ensemble photometry will get the uncertainty estimate from the
ensemble and so their target uncertainties will be reliable.
I hope that helps. Whether or not you agree with the process, the requirement for the
AAVSO Extended Format is that both comparison and check magnitudes *must* be instrumental.
UNQUOTE
In the "NOTES" field of AAVSOreport, LesvePhotometry includes a comment giving the standard magnitude values for the comparison and check star.
First and Second-order extinction coefficients
Earth's atmosphere is not completely transparent; this effect is quantified by the atmospheric extinction.
This extinction has two parts. The first-order extinction is dependent on the airmass and the filter bandpass.
The second-order extinction is dependent of the airmass, the filter bandpass and the color-index of the object.
For the V band, the observed V magnitude , is given by
V = Vo + k'X + k"(B-V)X
where
Vo is exo-atmospheric magnitude
X is the airmass
k' is the first-order extinction coefficient
k" is the second-order extinction coefficient
(B-V) is star color-index
The k' and k" coefficients are different for each filter bandpass.
If the airmasses of comparison stars and the target star are close,
which is the case for a small field (e.g., < 30 arcminutes),
the correction for first and second order extinctions may often be neglected.
The corrections become important for a large field of view (e.g., > 1 degree) and for stars with extreme color index, (e.g., (B-V)>2).
The first-order extinction varies somewhat from night to night as a function of the sky transparency.
For a pristine sky, k' is typically 0.2-0.3 magnitude per airmass for V band,
but it may increase significantly if the sky is not perfect (if the sky is cloudy/opaque, k' tends to infinity).
In summer, aerosols are more important, which increases the optical depth and the first-order atmospheric extinction.
A table of average sea-level, first-order extinction for the U,B,V,R and I bands is provided in
http://spiff.rit.edu/classes/phys445/lectures/atmos/atmos.html
k' = 0.6 for U
k' = 0.4 for B
k' = 0.2 for V
k' = 0.1 for R
k' = 0.08 for I
The second-order extinction k" is not easy to measure and for B band it is about -0.035 magnitude per color-index per airmass,
but for V,R,I band they are usually insignificant (0).
To estimate the first-order extinction coefficient, the "Lew's Plotter" spreadsheet
generated by LesvePhotometry is helpful.
The "C&K v Air Mass" sheet provides a graph
of the instrumental magnitudes of comparison stars versus the airmass and
the linear regression equations (y = ax + b).
The "a" slope value is not exactly the first-order extinction coefficient.
Indeed, the slope of v versus X is equal to (k' + k"(B-V)).
But as k" is small, the slope calculated in the "C&K v Air Mass" graph is a good estimation of the first-order extinction coefficient.
Recommended references
- Transparency and Atmospheric Extinction
https://www.skyandtelescope.com/astronomy-resources/transparency-and-atmospheric-extinction/
Atmospheric effects: extinction and seeing
http://spiff.rit.edu/classes/phys445/lectures/atmos/atmos.html
- All-Sky Photometry, Procedures used at Hereford Arizona Observatory.
Bruce Gary
http://brucegary.net/allsky2011/
- The Magnitude and Constancy of Second-Order Extinction at a Low-Altitude Observatory Site
B. Buchheim
http://adsabs.harvard.edu/full/2005SASS...24..111B
- AAVSO forum
https://www.aavso.org/secondary-extinction-and-blue-red-pairs
https://www.aavso.org/extrinsic-color-and-differential-airmass-corrections
How the Barycentric Julian Date - Terrestrial Time (BJD_TT) is calculated?
Precise timing of astronomical observations is important.
Heliocentric Julian Dates (HJD) takes account of the Earth rotation around the Sun, the observed time of an event
depends on the position of the observer in the Solar System. HJD may differ from Julian Date (JD) by as much 8.3 minutes.
The Earth is not orbiting around the Sun center but around the Solar System Barycenter (SSB).
Barycentric Julian Date (BJD) will take account of this fact.
The difference between BJD and HJD may be as much as 4 seconds and mainly depends on of Jupiter's and Saturn's positions.
Barycentric Julian Date - Terrestrial Time (BJD_TT) also takes account of the Earth rotation
speed decrease. Universal Time (UT) and Julian Date (JD) are affected by the Leap seconds inserted
at the end of June or December when required. The number of Leap seconds for year before 2021 are known by the program.
Ad end of 2020 the number of Leap seconds since 1972 is 27.
For years after 2020, the user has to introduce the number of Leap seconds since 1972 in the tab "General settings",
This value will may be found here https://en.wikipedia.org/wiki/Leap_second
The time difference in JD between two events doesn't take account of the eventual Leap seconds, the BJD_TT does it.
The detailed procedure to calculate the BJD_TT is provided
in Eastman et al. 2010 paper https://arxiv.org/abs/1005.4415
The coordinates of the SSB needed to calculate the difference between JD and BJD are obtained with the Telnet interface of "JPL's HORIZONS" tool
https://ssd.jpl.nasa.gov/?horizons
You may compare the calculated LesvePhotometry BJD_TT with the values given by the online applet
http://astroutils.astronomy.ohio-state.edu/time/utc2bjd.html
which converts UT or JD to Barycentric Julian Dates - Barycentric Dynamical Time (BJD_TDB)
BJD_TDB takes account of relativistic delays (Shapiro anns Einstein) which is not the case for BJD_TT.
The difference between BJD_TDB and BJD_TT calculated with LesvePhotometry is about a few tenths of second .
This BJD_TT precision is enough even for exoplanet observations.
Launch LesvePhotometry program from a Command Line
The program can also be launched from a Command Line for batch processing on remote observatory.
The argument to LesvePhotometry.exe is the full path
to the directory where the images are stored. The content of a batch file or a script would be similar to :
C:
cd "C:\Program Files (x86)\Common Files\DPP Lesve\LesvePhotometry"
LesvePhotometry.exe "D:_AstroImages\testimages4LP"
The images with the extensions (fit, fts and fits) will be reduced and their reports created as usual.
The Command Line accetps optional arguments :
/s to run the program silently i.e. without opening the LesvePhotometry windows and any trapped errors
will not reported in a message box but in an error file to avoid user-interaction which would block the batch process
/cf to specify the configuration file to be used instead of the using settings of the last session of the program.
The content of a batch file would be similar to :
C:
cd "C:\Program Files (x86)\Common Files\DPP Lesve\LesvePhotometry"
LesvePhotometry.exe /s /cf "C:\Users\pierr\Documents\DPP Lesve\ConfigurationTest.txt" "D:_AstroImages\testimages4LP"
Before distributing the reports it remains important for the user to assess the data quality.
Blind transmission of the bad quality data must be avoided for obvious reasons. It would also degrade the LesvePhotometry reputation.
It's the reason why the Excel reports will be leaved open on the computer screen except if program runs silently.
The Reinsch window will also not open in silent mode as it is a user-interactive window which would block the batch process.
This additional "Command Line" feature is transparent for users who don't use it.
I have more than one Variable in the image field?
If you have more than one Variable in your images, you may use the Command Line mode as described in the following document : ManyVariablesInField.txt.
Single Filter Transformation
The normal transformation procedure utilizes a series of repeated images collected with multiple filters
(e.g., BVRIBVRI or VIVIVI), to which magnitude corrections are applied based on the measured magnitudes and
colors, and applicable transformation coefficients.
However, for image series composed of images in 1 or 2 filters, it is possible to conduct single filter transformation (SFT) if certain specific assumptions
concerning the variable star’s color during its period are made. SFT may be applied to a time series of
repeated images with either of two characteristics:
1. a time series collected with one filter regularly
interspersed with a second filter (e.g., IVVVVVIVVVVV….),
or
2. a time series collected with only one
filter (e.g., VVVVVVVVVV…).
In the first condition, the color of the variable is calculated at regular intervals, and this measured
color (e.g., V-I) and applicable transformation coefficient (e.g., Tv_vi) is used for correction of the
subsequent magnitudes of the common filter (e.g., V). This correction yields a more accurate
magnitude than that obtained without transformation.
In the second condition, the color of the variable is assumed to be constant at the mean color of the
variable (e.g., V-I) over its period. Although this assumption is not strictly true for many types of
variables, the amplitude of the color change is small enough that any magnitude correction due to the
difference in the mean color of the target and the constant color of the comp star(s) and typical
transformation coefficients yields a more accurate standard magnitude than any non-transformed
magnitude.
To use Single Filter Transformation, fill the corresponding check box in the "Transform param" tab.
For time series collected with only one filter like VVVVV, the user has to enter the Variable color
(e.g. VI = 0.25) and the corresponding second filter I.